
Table of Contents
Most advertisers are chasing ghosts. In the high-velocity digital landscape of 2026, where Meta’s Andromeda AI dictates the efficiency of every impression, the biggest mistake you can make isn’t a bad creative or a wrong interest—it’s optimizing for a number that doesn’t actually pay your bills.
If your dashboard shows a 5x ROAS but your bank account is stagnant, you have a metric alignment problem. This is the “ROAS Trap,” and to escape it, you need a sophisticated Meta ads KPI alignment strategy. As a specialist with over 9 years in this game, I’ve seen countless brands scale themselves into bankruptcy because they were looking at campaign-level vanity instead of business-level reality.
This 3,000-word blueprint is designed to bridge the gap between aligning Meta ads with business goals and the raw technical execution required to achieve marketing efficiency ratio (MER) targets that drive true profit.
Meta Ads KPI Alignment Strategy
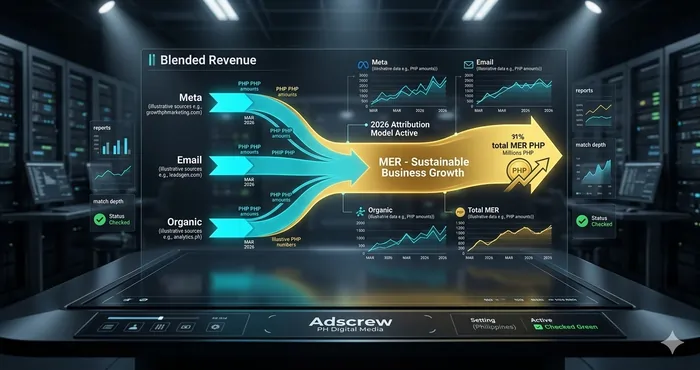
A successful Meta ads KPI alignment strategy transitions a business from platform-centric metrics to holistic financial outcomes. While Return on Ad Spend (ROAS) is a vital micro-metric for creative testing, it often fails to account for operational costs, taxes, and shipping. The Marketing Efficiency Ratio (MER) serves as the ultimate macro-metric, measuring total revenue against total marketing spend. By aligning Meta ads with business KPIs through a funnel-based approach—where TOFU focuses on reach and BOFU focuses on profit—advertisers can scale with confidence, ensuring that every peso spent in the Meta auction results in a positive contribution margin.
The ROAS Illusion – Why Your Dashboard is Lying to You
In the early days of Facebook advertising, ROAS was the king. If you put in ₱1 and got back ₱5, you won. But in 2026, the ecosystem is more complex. Privacy laws, signal loss, and attribution tracking Meta ads challenges mean that the number you see in the Ads Manager is often an estimate, not a bank statement.
The Problem with Campaign-Level ROAS
ROAS is a vacuum metric. It calculates
$$\text{ROAS} = \frac{\text{Total Revenue from Ads}}{\text{Total Ad Spend}}$$
but it ignores:
- Cost of Goods Sold (COGS): If your product costs ₱500 and you sell it for ₱1,000, a 2x ROAS means you’ve broken even—before accounting for labor, shipping, or Meta’s ₱200 acquisition cost.
- Attribution Lag: Meta often claims credit for sales that were actually driven by your email list or organic search.
- Operating Expenses: Your agency fees, software subscriptions (like Shopify), and overhead are never reflected in the ROAS column.
This is why ROAS is misleading when used as the sole north star for scaling. To truly improve Meta ads profitability, you must look beyond the individual campaign.
Defining MER – The Holistic View of Business Health
If ROAS is a pulse check, the Marketing Efficiency Ratio (MER) is a full-body scan.
What is MER in Marketing?
MER is calculated as:
$$\text{MER} = \frac{\text{Total Revenue (All Channels)}}{\text{Total Ad Spend (All Channels)}}$$
This is often referred to as “Blended ROAS.” It tells you how hard your marketing dollars are working to grow the entire company.
The Difference Between MER and ROAS
The difference between MER and ROAS is the scope of the data.
- ROAS tells you: “How did this specific video ad perform yesterday?”
- MER tells you: “Is my total marketing investment sustainable relative to my total business growth?”
When aligning Meta ads with business goals, MER allows you to see the “Halo Effect.” For example, a high-top-of-funnel spend might show a 1x ROAS on Meta, but if your organic search revenue spikes by 30% during that same period, your MER will reflect the true value of that Meta spend.
Funnel-Based KPI Alignment – Stage-by-Stage Mastery
To build a Meta ads performance metrics strategy that scales, you cannot use the same KPI for every campaign. A funnel structure for high-ticket services requires a different set of eyes than a low-ticket impulse buy.
1. Top of Funnel (TOFU): The Awareness KPIs
At this stage, you are buying attention. Optimizing for ROAS here is a mistake.
- Primary KPIs: CPM (Cost Per 1,000 Impressions), ThruPlays, and CTR (Link Click-Through Rate).
- Goal: Efficient reach. You want the Andromeda engine to find the largest possible audience of “Interested” users at the lowest possible cost.
- Expert Tip: Monitor your “Thumb-Stop Ratio.” If your 3-second video view rate is below 30%, your creative is failing before the algorithm even has a chance to help you.
2. Middle of Funnel (MOFU): The Consideration KPIs
This is where you bridge the gap. You’re moving users from “I saw this” to “I need this.”
- Primary KPIs: CPC (Cost Per Click), Landing Page Views, and Add to Cart.
- Goal: Traffic quality. You are looking for signals that the traffic vs conversion campaign logic is working.
- Strategic Alignment: At this stage, you should be tracking Blended CAC (Customer Acquisition Cost). How much are you paying for a visitor to enter your retargeting pool?
3. Bottom of Funnel (BOFU): The Conversion KPIs
This is where the rubber meets the road.
- Primary KPIs: CPA (Cost Per Action), ROAS, and Conversion Rate.
- Goal: Direct profitability. Every campaign here should be measured against your Contribution Margin.
- Scaling Metric: Use the Sales Objective vs Catalog Sales to decide which format delivers the highest immediate return.
The Contribution Margin – The Secret to Scaling Profitably
If you want to scale Meta ads profitably, you must understand your Contribution Margin. This is the amount of money you have left after paying for the variable costs of a sale.
$$\text{Contribution Margin} = \text{Revenue} – (\text{COGS} + \text{Shipping} + \text{Transaction Fees} + \text{Ad Spend})$$
A Meta ads KPI alignment strategy that doesn’t account for margin is just a revenue-spinning wheel. In 2026, we see many “7-figure” brands with zero profit because their CPA is higher than their margin.
Blended CAC vs. LTV
The ultimate goal of aligning Meta ads with business KPIs is to ensure that your Blended CAC is significantly lower than your Customer Lifetime Value (LTV).
- If your LTV is ₱10,000, you can afford a ₱2,000 CAC.
- If your LTV is only ₱2,000, that same ₱2,000 CAC will kill your business.
This is why Meta value optimization strategy is so important—it tells Meta to find the buyers who will spend more over time, not just once.
Technical Attribution in the Andromeda Era
In 2026, attribution tracking Meta ads has moved away from the “last-click” model. Meta’s AI now uses probabilistic modeling to guess which ads led to a sale.
The Role of CAPI (Conversions API)
To measure Meta ads performance correctly, you must have a server-to-server connection. Meta’s CAPI bypasses browser-side ad blockers and provides the “Clean Data” required for the AI to optimize. Without this, your ROAS will look lower than it actually is, causing you to turn off winning campaigns prematurely.
First-Party Data & CRM Alignment
Your Facebook ads KPI alignment should include a data bridge to your CRM (like HubSpot). This allows you to track “Offline Conversions”—sales that happen in the real world or over the phone—and attribute them back to the original Meta click. For businesses using instant forms vs landing pages, this feedback loop is the difference between success and failure.
The MER Blueprint – How to Scale Using Efficiency Ratios
Scaling is a game of budget allocation. The MER vs ROAS explained Meta ads framework suggests a three-step scaling process:
- Phase 1: Efficiency Lock (The 30-Day Baseline)Before scaling, establish your “Profitable MER.” If your business is profitable at a 4.0 MER, that is your ceiling.
- Phase 2: Vertical Scaling (Pushing the Budget)Increase your Meta spend by 20% every 48 hours. Watch your Campaign ROAS for stability, but use your Total Business MER to decide when to stop.
- Phase 3: Creative DiversificationAs you scale, ROAS will naturally dip. This is normal. To keep your MER stable, you must launch new “Creative Hooks” to lower your TOFU costs.
Remember, the goal is to increase marketing efficiency ratio, not just total revenue. A ₱10M month with 10% profit is worse than an ₱8M month with 25% profit.
KPI Alignment for Service-Based Businesses
If you aren’t selling a physical product, how to align Meta ads with business KPIs shifts toward lead quality.
From Lead to Booked Call
In high-ticket services, a “Lead” is a vanity metric. Your Meta ads KPI strategy should focus on:
- CPL (Cost Per Lead): The micro-metric.
- CPB (Cost Per Booked Call): The optimization metric.
- CAC (Cost Per Closed Deal): The business metric.
By mapping your campaign objectives to these three stages, you ensure that you aren’t just paying for ₱50 leads that never answer the phone. You are paying for ₱2,000 appointments that turn into ₱50,000 retainers.
20-Question FAQ: Meta Ads KPI Alignment Strategy
- What is MER in Meta ads? MER (Marketing Efficiency Ratio) is total business revenue divided by total marketing spend. It’s the “Big Picture” metric.
- How is MER different from ROAS? ROAS measures a specific campaign’s revenue; MER measures the whole business’s marketing health.
- Why is ROAS misleading for e-commerce? It ignores costs like COGS, shipping, and agency fees. You can have a “green” ROAS and still be losing money.
- What is a “good” MER? This depends on your profit margins. Generally, a 4x MER (25% marketing spend) is healthy for most e-commerce brands.
- How do I track MER? Use a blended dashboard (like Triple Whale or a custom Google Sheet) that pulls data from Meta and your store.
- Should I stop optimizing for ROAS? No. Use ROAS for day-to-day ad set management and creative testing. Use MER for high-level budget decisions.
- What metrics matter in Meta ads scaling? MER, Contribution Margin, and Blended CAC.
- How to align Meta ads with business KPIs? Match your funnel stages to specific goals: TOFU (Awareness), MOFU (Intent), BOFU (Profit).
- What is Blended CAC? Your total marketing spend divided by total new customers acquired across all channels.
- How do I improve Meta ads profitability? By lowering your CAC through better creative and increasing your LTV through email marketing and retargeting.
- What is the “Halo Effect”? When your Meta ads drive users to search for your brand on Google and buy there. MER captures this; ROAS does not.
- How to measure Meta ads performance correctly? Combine Meta’s native data with CAPI server-side signals and third-party attribution tools.
- What are the best KPIs for Meta ads campaigns? CPC and CTR for traffic; CPA and ROAS for sales; MER for the business.
- How do I optimize Meta ads for profit not ROAS? By calculating your “Break-even ROAS” and optimizing based on your Contribution Margin.
- What is the Andromeda engine? Meta’s latest AI delivery system that prioritizes user intent and creative relevance over old-school interest targeting.
- How to track profitability Meta ads? Deduct all variable costs (COGS, Shipping, Fees) from your ad-driven revenue to find your “Ad Profit.”
- Does ROAS include taxes? Usually not. This is another reason why it can be misleading for international brands.
- How to lower customer acquisition cost Meta ads? Improve your “Thumb-Stop Ratio” and landing page conversion rate.
- What is a contribution margin? The profit left after variable costs. This is the only money that actually “contributes” to your fixed overhead.
- Should I hire Adscrew PH? If your MER is below 3x and you can’t find the leak in your funnel, a technical audit is mandatory.
Direct Answers
How do you align Meta ads with business KPIs?
To align Meta ads with business KPIs, you must map your campaign objectives to the specific stages of your customer journey. Use Awareness objectives for reach, Traffic objectives for intent-building, and Sales objectives for direct revenue. Crucially, verify campaign-level ROAS against business-level MER to ensure total profitability.
What is the difference between MER and ROAS in digital marketing?
ROAS (Return on Ad Spend) is a platform-specific metric that measures the direct revenue attributed to a specific ad campaign. MER (Marketing Efficiency Ratio) is a blended metric that measures total business revenue against total marketing spend across all channels, providing a more accurate view of a company’s financial health.
Why is ROAS an unreliable metric for scaling?
ROAS is unreliable for scaling because it does not account for the “Full Cost of Sale,” including inventory costs, labor, and platform signal loss. A brand can have a high ROAS but a negative net profit if their acquisition costs are too high relative to their contribution margins.
Summary: The Final Strategic Takeaway
The Meta ads KPI alignment strategy is the difference between a business that grows and a business that just spends money. In 2026, the brands that win are the ones that stop looking at the “Green Numbers” in the Ads Manager and start looking at the “Gold Numbers” in their bank accounts.
- Measure ROAS to find your winning ads.
- Measure MER to find your winning business strategy.
- Align both to scale without fear.
Remember, in performance marketing:
👉 Efficiency is the strategy. Metrics are just the tools.